Project · ASR Models Fairness on Accents and Ethnicities
How Input Audio Compression Affects ASR Fairness Across Ethnicity Groups
Abstract
This report studies how input audio compression affects ASR fairness on FairSpeech. It builds on Srishti Ginjala’s COLM 2026 work, Do LLM Decoders Listen Fairly?, which studies how ASR decoder priors and audio bottlenecks shape demographic error gaps (Ginjala et al., 2026). The audit covers 26,471 utterances, nine ASR models, and six audio variants. Across the 54 model–variant runs, Black/AA speakers have the highest WER. MP3 16 kbps is the strongest accuracy stressor; Qwen3 models are the most compression-robust; Granite 2B is the most compression-sensitive. MMR often changes less than WER, so relative fairness must be read together with absolute accuracy.
1 FairSpeech Compression Evaluation
1.1 Motivation
Production ASR rarely receives ideal audio. Speech may be recorded, uploaded, transcoded, downsampled, and normalized before inference. The audio audit separates these input-file effects from model-internal acoustic bottlenecks. This motivates a FairSpeech-only test: hold the speaker labels, reference text, and ASR model fixed, then vary the input audio path. The fairness question is simple: if degradation raises WER uniformly, accuracy drops; if MMR rises, input compression may amplify ethnicity-level disparity.
| Pattern | FairSpeech test proxy |
|---|---|
| Lossy codec / lower bitrate | MP3 64, 32, and 16 kbps variants test whether removed acoustic detail changes WER or disparity. |
| Bandwidth bottleneck | 12 kHz and 8 kHz round trips test reduced frequency information. |
| ASR input normalization | Every variant returns to 16 kHz mono before inference, so models receive compatible audio. |
| Model-internal compression | The nine-model set compares architectures with different acoustic bottlenecks; this is separate from input-codec compression. |
1.2 Scope
| Element | Plan / state |
|---|---|
| Main question | Does input degradation change ethnicity-level ASR error and disparity? |
| Input source | Uniform 16 kHz mono PCM WAV. |
| Run matrix | 9 models × 6 variants × 26,471 samples. |
| Inference runs | 54. |
| Prediction rows | 1,429,434 utterance-level rows. |
| Metric tables | Group WER, MMR, paired ΔWER, insertion subtype rates. |
| Variant | Pipeline and purpose |
|---|---|
| Baseline | 16 kHz PCM WAV → model; clean source condition. |
| 12 kHz bottleneck | 16 kHz → 12 kHz → 16 kHz; moderate bandwidth loss. |
| 8 kHz bottleneck | 16 kHz → 8 kHz → 16 kHz; telephone-like bandwidth loss. |
| MP3 64 kbps | WAV → MP3 64 kbps → WAV; mild lossy artifact. |
| MP3 32 kbps | WAV → MP3 32 kbps → WAV; moderate lossy artifact. |
| MP3 16 kbps | WAV → MP3 16 kbps → WAV; strong lossy artifact. |
1.3 Model set
| Model key | Paper | Params |
|---|---|---|
| wav2vec2-large | Baevski et al., 2020 | 317M |
| whisper-small | Radford et al., 2022 | 244M |
| whisper-medium | Radford et al., 2022 | 769M |
| whisper-large-v3 | Radford et al., 2022 | 1.55B |
| qwen3-asr-0.6b | Shi et al., 2026 | 0.6B |
| qwen3-asr-1.7b | Shi et al., 2026 | 1.7B |
| canary-qwen-2.5b | NVIDIA, 2025 | 2.5B |
| granite-speech-3.3-2b | Saon et al., 2025 | 2B |
| granite-speech-3.3-8b | Saon et al., 2025 | 8B |
1.4 Metric definitions
This report follows Ginjala et al. (2026) in using WER and MMR as the main accuracy and fairness measures.
WER: Word Error Rate. For ethnicity group g, WER aggregates substitutions (Sg), deletions (Dg), insertions (Ig), and reference words (Ng):
MMR: Max/Min Ratio. MMR is the worst group WER divided by the best group WER:
WER measures accuracy; MMR measures relative disparity. Lower is better for both.
1.5 Implementation guardrails
| Guardrail | Reason |
|---|---|
| Keep IDs fixed | Compare the same utterances across variants. |
| Keep transcript fixed | WER changes should come from ASR output, not reference drift. |
| Use real resampling | Never fake a sample rate by changing only file headers. |
| Separate variant types | Sample-rate bottlenecks and MP3 bitrate artifacts answer different questions. |
| Batch by duration | Long clips make one global sample-count batch size unsafe. |
| Uncertainty | Bootstrap intervals are absent, so small gaps need cautious interpretation. |
2 FairSpeech Dataset
FairSpeech is the controlled evaluation source for this report, following the FairSpeech-focused analysis setting in Ginjala et al. (2026). The dataset chapter describes the evaluation unit, demographic coverage, and data cautions.
2.1 Dataset summary
| Field | Value |
|---|---|
| Unit of analysis | One utterance: one WAV file, one transcript, and one ethnicity label. |
| Scale | 26,471 utterances; 55.55 hours of speech. |
| Audio format | 16 kHz mono 16-bit PCM WAV. |
| Text prompts | 23,046 unique prompted sentences. |
| Alignment | Every metadata row has exactly one matching audio file. |
| Primary fairness axis | Ethnicity; all utterances have an ethnicity label. |
| Experiment role | Clean source for input-codec and resampling evaluation. |
2.2 Ethnicity coverage
| Ethnicity | Rows | Share |
|---|---|---|
| Black or African American | 7,807 | 29.5% |
| White | 5,646 | 21.3% |
| Native American, American Indian, or Alaska Native | 4,632 | 17.5% |
| Asian, South Asian, or Asian American | 3,854 | 14.6% |
| Hispanic, Latino, or Spanish | 2,814 | 10.6% |
| Native Hawaiian or Other Pacific Islander | 969 | 3.7% |
| Middle Eastern or North African | 749 | 2.8% |
Coverage note. The largest ethnicity group is about ten times the size of the smallest group. For this reason, MMR should be read alongside group WER: a low ratio can still hide uniformly high error.
2.3 Suitability and limits
| Point | Implication |
|---|---|
| Uniform source audio | Compression variants can be compared from the same clean starting format. |
| Complete pairing | Each utterance can be tracked across all audio variants. |
| Complete ethnicity labels | Ethnicity-level WER and MMR can be computed for every run. |
| Duration tail | Clips range from 1.36–65.62 s; duration-aware batching is needed. |
| Self-reported labels | Demographic categories should be treated as coarse, self-reported groups. |
| Uneven group sizes | Small groups need cautious interpretation, especially without bootstrap intervals. |
3 Results and Analysis
3.1 Baseline model comparison
Table 9 gives the clean-audio reference point. WER measures overall accuracy. MMR measures ethnicity-level relative disparity.
| Model | WER | MMR | Best group | Worst group |
|---|---|---|---|---|
| Qwen3-1.7B | 4.74 | 3.03 | White | Black/AA |
| Qwen3-0.6B | 5.92 | 3.66 | White | Black/AA |
| Canary-2.5B | 6.62 | 3.45 | Asian | Black/AA |
| Whisper-L | 7.77 | 3.15 | Asian | Black/AA |
| Granite-8B | 8.00 | 2.21 | Pacific Isl. | Black/AA |
| Whisper-M | 8.77 | 3.25 | Asian | Black/AA |
| Granite-2B | 9.37 | 2.50 | Pacific Isl. | Black/AA |
| Whisper-S | 11.40 | 4.08 | Asian | Black/AA |
| wav2vec2-L | 31.72 | 1.58 | White | Black/AA |
3.2 WER under compression
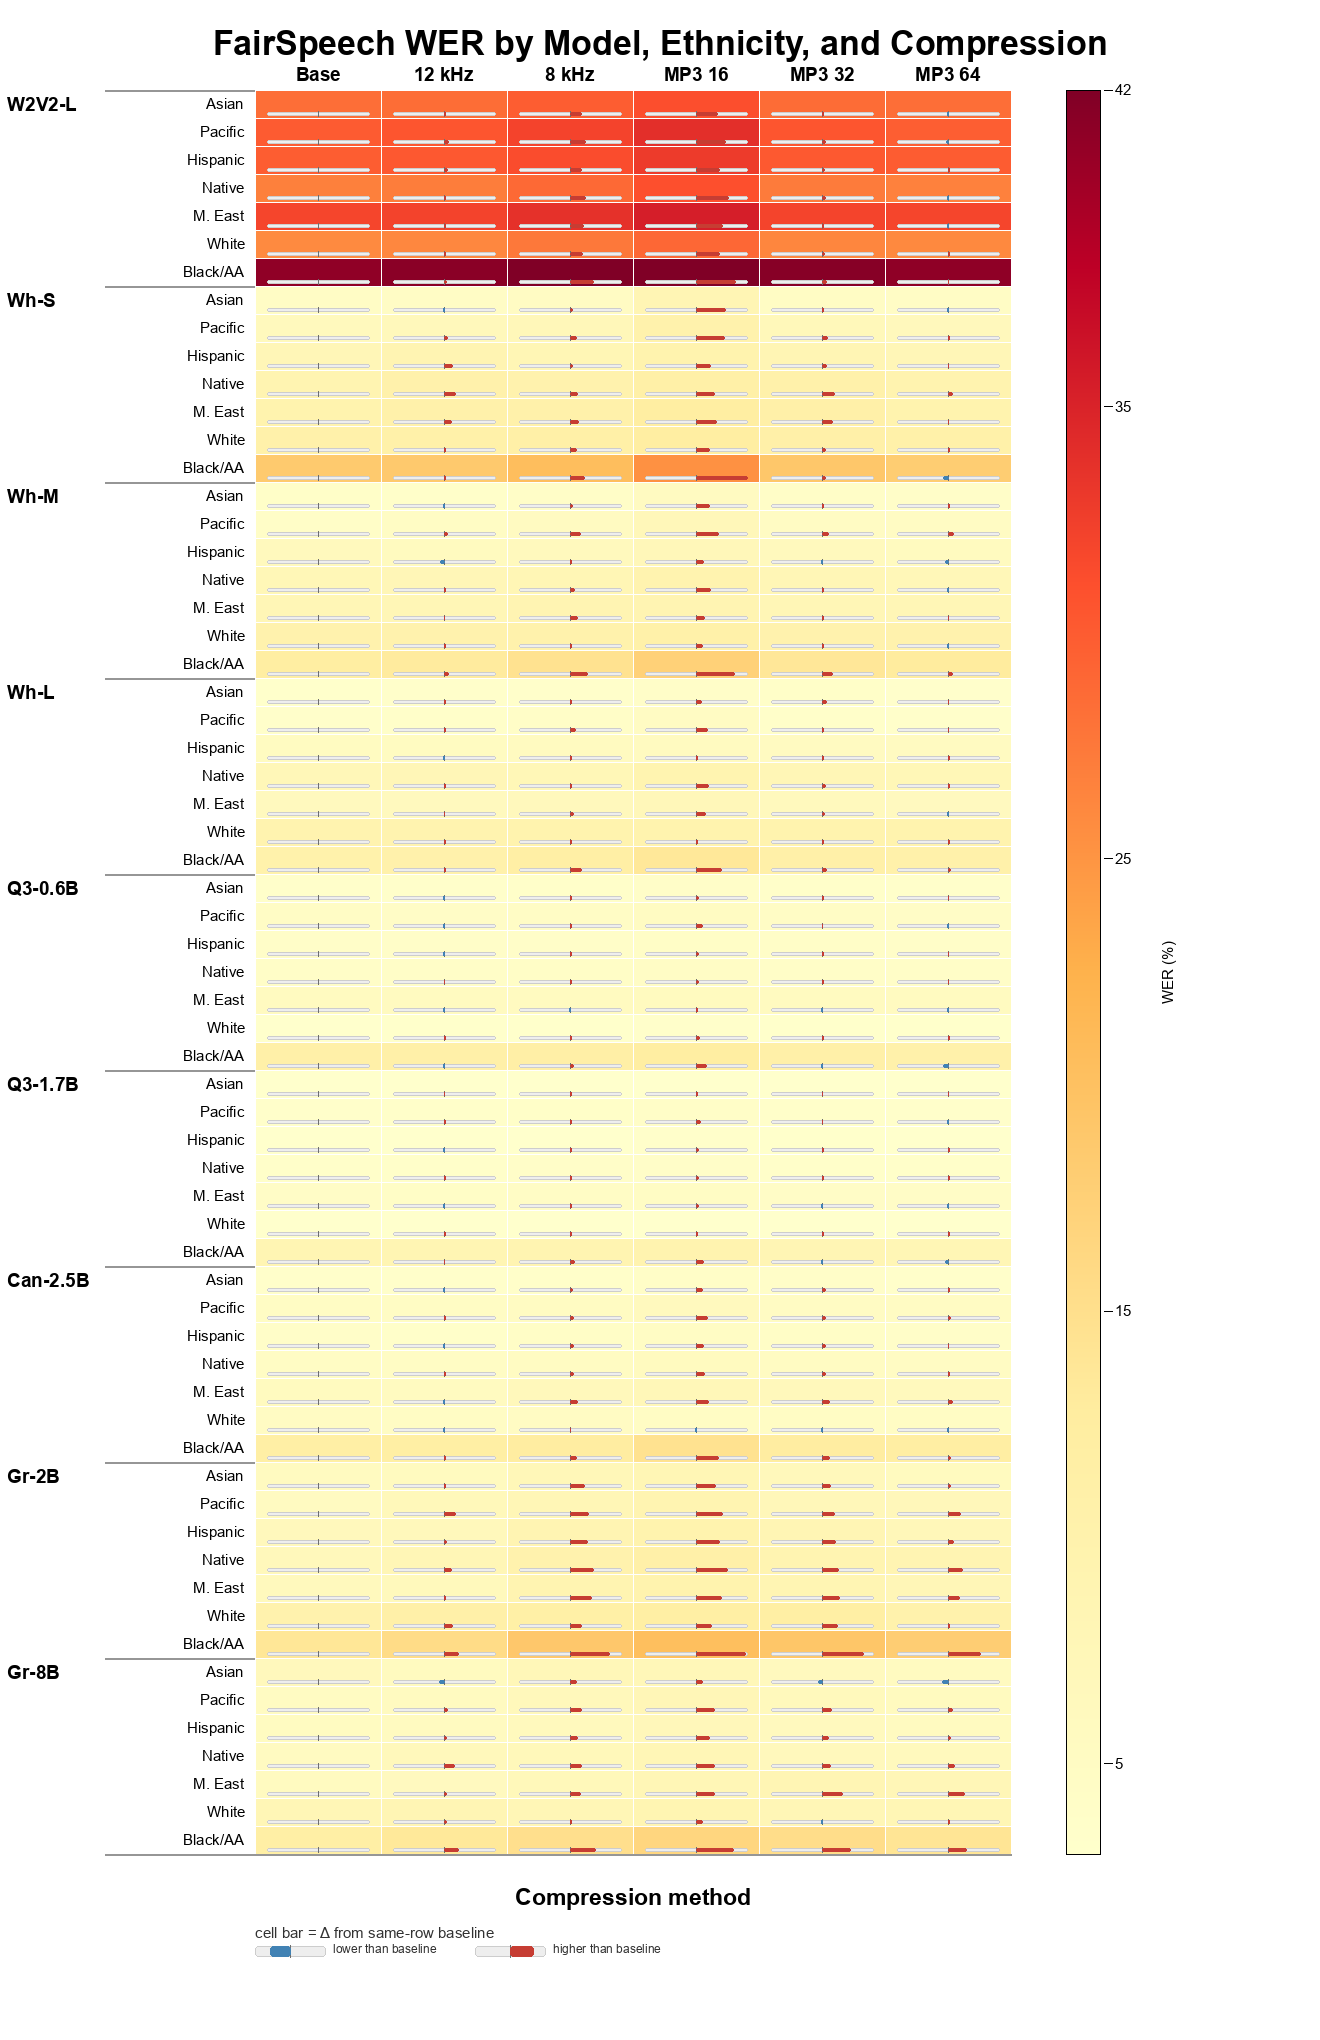
Figure 1 is the main accuracy view. Each model has seven ethnicity rows and six compression columns. The color shows WER. The in-cell bar shows the change from that same model–ethnicity baseline.
3.3 MMR under compression
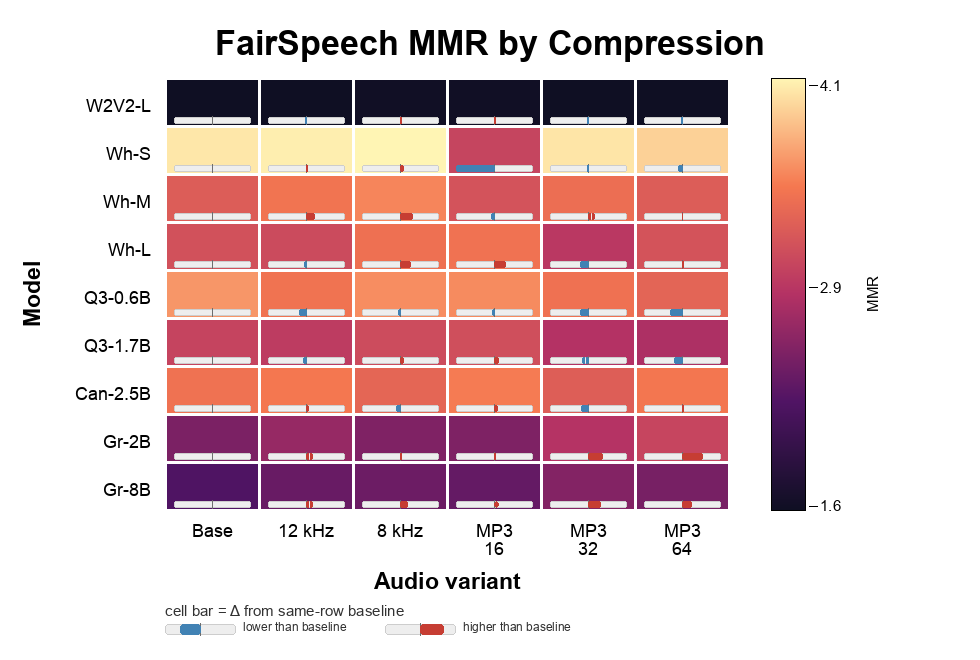
Figure 2 summarizes relative disparity. MMR can stay flat even when WER rises, so it should be read after the WER heatmap.
3.4 Accuracy–fairness tradeoff
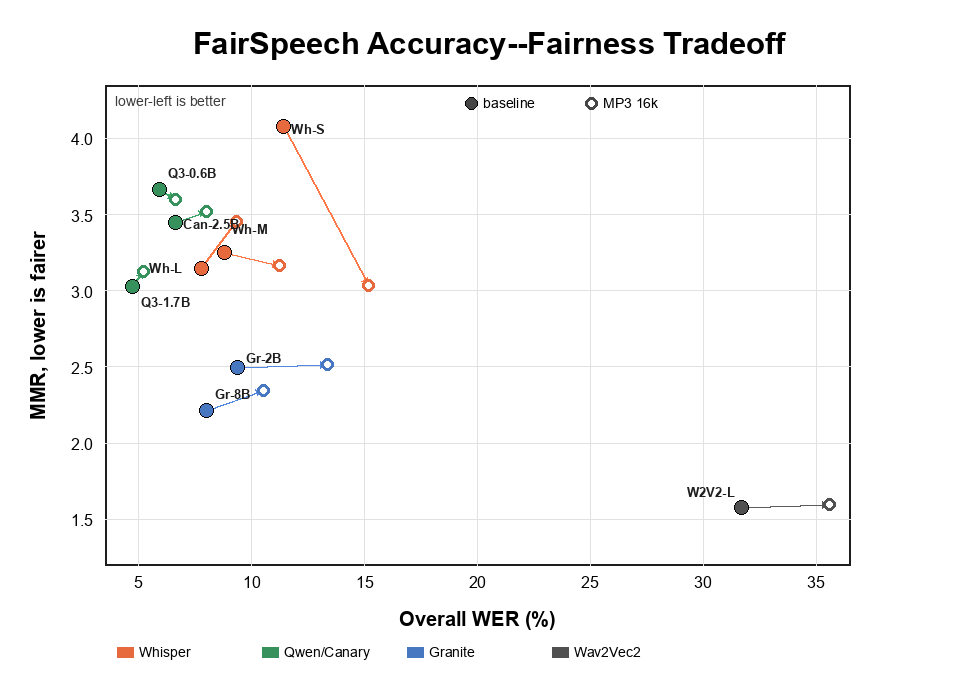
Following the tradeoff view in Ginjala et al. (2026), Figure 3 plots overall WER against MMR. Filled points are baseline runs. Hollow points show MP3 16 kbps.
3.5 Compression summary
| Variant | ΔWER mean | MMR ratio | Most hit | Reading |
|---|---|---|---|---|
| 12 kHz | +0.33 | 1.02× | Gr-2B | Mild bandwidth loss. |
| 8 kHz | +1.14 | 1.03× | Gr-2B | Clear bottleneck effect. |
| MP3 64 | +0.34 | 1.02× | Gr-2B | Mild lossy effect. |
| MP3 32 | +0.77 | 1.01× | Gr-2B | Moderate lossy effect. |
| MP3 16 | +2.30 | 0.99× | Gr-2B | Largest WER hit. |
Result observations.
- Black/AA is the highest-WER group in all 54 model–variant runs.
- Qwen3 models are most robust to compression; both Qwen3-0.6B and Qwen3-1.7B average only about +0.16 pp WER.
- Granite-2B is most sensitive; it averages about +2.57 pp WER and is the most affected model for every compression variant.
- MP3 16 kbps is the strongest stress test: mean WER rises by +2.30 pp, compared with +1.14 pp for the 8 kHz bottleneck.
- Low MMR can be misleading: wav2vec2-L has the lowest baseline MMR, 1.58, but very high WER, 31.72%.
- MMR does not always rise when WER rises. MP3 16 has the largest WER increase, but its mean MMR ratio is about 0.99×.
- Insertion errors are not the whole story. MP3 32 and MP3 64 raise WER while slightly reducing average insertion rate.
References
- Alexei Baevski, Yuhao Zhou, Abdelrahman Mohamed, and Michael Auli. 2020. wav2vec 2.0: A Framework for Self-Supervised Learning of Speech Representations. Advances in Neural Information Processing Systems, 33:12449–12460. arxiv.org/abs/2006.11477
- Srishti Ginjala, Eric Fosler-Lussier, Christopher W. Myers, and Srinivasan Parthasarathy. 2026. Do LLM Decoders Listen Fairly? Benchmarking How Language Model Priors Shape Bias in Speech Recognition. arXiv preprint arXiv:2604.21276. Under review at COLM 2026. arxiv.org/abs/2604.21276
- NVIDIA. 2025. NVIDIA NeMo Canary-Qwen-2.5B Model Card. Hugging Face model card. huggingface.co/nvidia/canary-qwen-2.5b
- Alec Radford, Jong Wook Kim, Tao Xu, Greg Brockman, Christine McLeavey, and Ilya Sutskever. 2022. Robust Speech Recognition via Large-Scale Weak Supervision. arXiv preprint arXiv:2212.04356. arxiv.org/abs/2212.04356
- George Saon, Avihu Dekel, Alexander Brooks, Tohru Nagano, Abraham Daniels, and others. 2025. Granite-speech: Open-source Speech-aware LLMs with Strong English ASR Capabilities. arXiv preprint arXiv:2505.08699. arxiv.org/abs/2505.08699
- Xian Shi, Xiong Wang, Zhifang Guo, Yongqi Wang, Pei Zhang, Xinyu Zhang, Zishan Guo, Hongkun Hao, Yu Xi, Baosong Yang, Jin Xu, Jingren Zhou, and Junyang Lin. 2026. Qwen3-ASR Technical Report. arXiv preprint arXiv:2601.21337. arxiv.org/abs/2601.21337